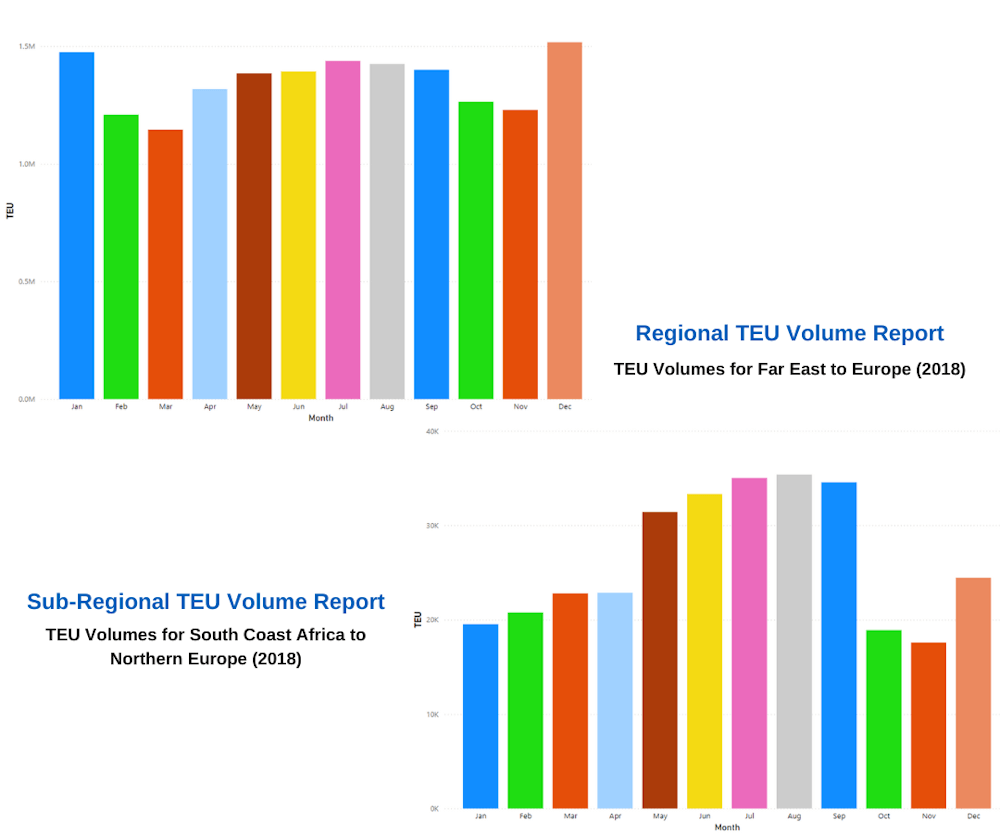
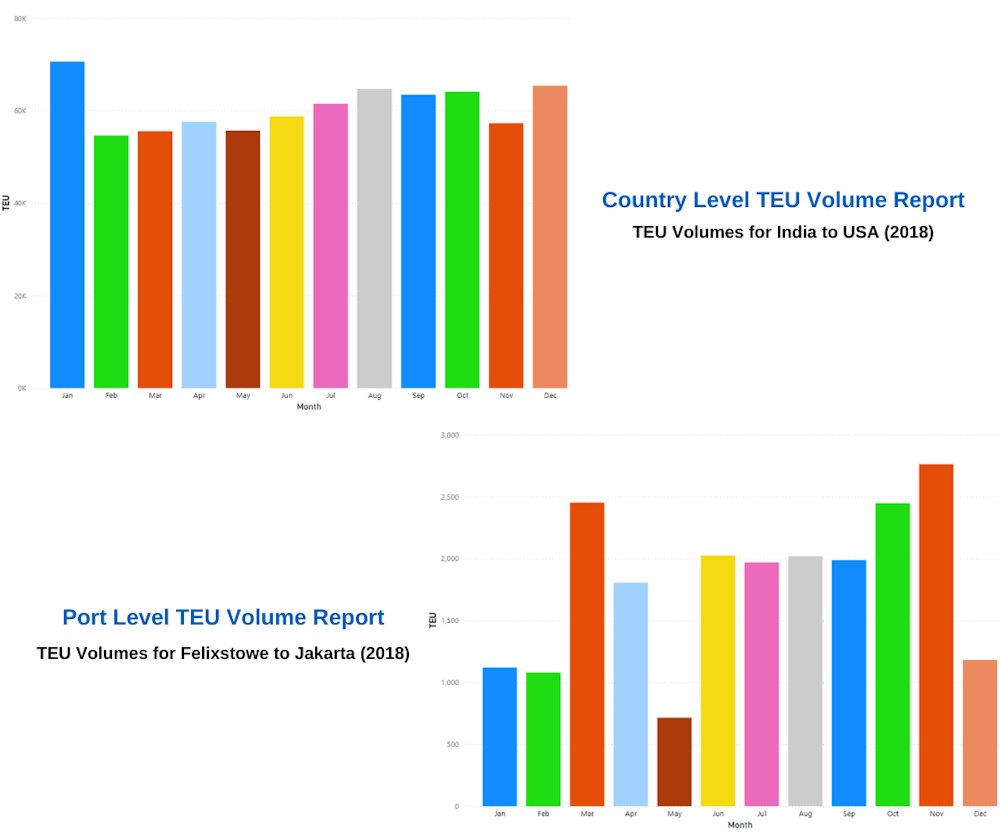
TEU Volumes
Explore industry supplied twenty-foot equivalent units (TEUs) data reported globally at all levels, including region, sub-region, country and port locations with CTS.
CTS boasts an impressive 75% coverage of actual global TEU movements directly sourced from contributing shipping lines’ manifests, ensuring our customers receive a comprehensive view of global shipping container movements.
- Reports available for purchase as a one-off dataset or through an ongoing subscription.
- Subscriptions sold in 12-month blocks with the previous 12 months of data provided for free.
- Each account accommodates up to five independent users.
For those shipping lines that do not contribute data, known as Non-Contributing Lines (NCLs), CTS employs a variety of high-level data sources to estimate the remaining 25% of volumes. This approach provides you with a comprehensive view of total global trade.
Explore industry supplied twenty-foot equivalent units (TEUs) data reported globally at all levels, including region, sub-region, country, and port location with CTS.
CTS boasts an impressive 75% coverage of actual global TEU movements directly sourced from contributing shipping lines’ manifests, ensuring our customers receive a comprehensive view of global shipping container movements.
- Reports available for purchase as a one-off dataset or through an ongoing subscription.
- Subscriptions sold in 12-month blocks with the previous 12 months of data provided for free.
- Each account accommodates up to five independent users.
For those shipping lines that do not contribute data, known as Non-Contributing Lines (NCLs), CTS employs a variety of high-level data sources to estimate the remaining 25% of volumes. This approach provides you with a comprehensive view of total global trade.
Power BI reports available upon request during data purchase.
Require Import/Export figures?
Whether you require detailed insights into import trends, export volumes or specific port activities, our bespoke reports deliver the precise information you need.
Region Pairs
Sub-Region Pairs
Country Pairs
Port Pairs
Region Pairs
Sub Region Pairs
Country Pairs
Port Pairs
Customers Who Use Our Data


Enquiry Form
Container Line Market Share Insights
Looking for more granular data? Explore our Price Indices or CTS Newsletter to unlock deeper insights now!
All figures are published monthly with a one-month time lag. CTS does not count transhipments or empty boxes.
To read more about the time lags on our TEU Volume Reports click HERE
Contact Us:
+44 1483 77 88 50
sales@containertradesstatistics.com
Container Trades Statistics Ltd
One Crown Square
Church Street East
Woking
GU21 6HR
UK